Undergraduate Programs
The program offers three different options in the major. Undergraduate students in Political Science can enhance and extend their learning through internships and the University Honors program.
The program offers three different options in the major. Undergraduate students in Political Science can enhance and extend their learning through internships and the University Honors program.
At the graduate level, the Political Science Program is a part of the Master of Public Policy (MPP) and the PhD in Public Policy. We also participate in the Master of Arts in Interdisciplinary Studies (MAIS), and offer a Political Science graduate minor.
Political Science offers both a major and minor through OSU Extended Campus ("Ecampus").
In the Public Policy Accelerated Master’s Platform, you can take graduate classes in public policy, apply those credits to major requirements, and transfer them to the Master of Public Policy (MPP) program. Learn more!
Student Focus
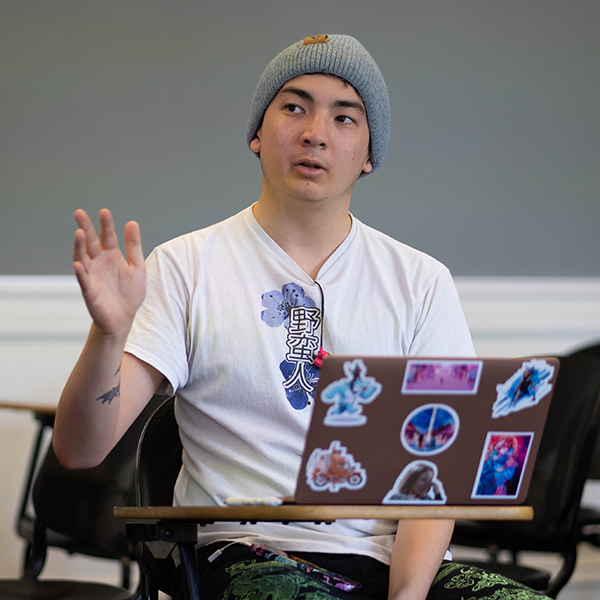
In a world more socially connected than at any other moment in history, the importance of collaborative, diverse and interdisciplinary approaches to solving problems has become increasingly valued. Jax Richards is a student at Oregon State University who recognized that very early.
OSU’s campus culture inherently encourages students in the College of Liberal Arts, the second most populated college on campus, to communicate and make connections with students from other seemingly distant fields.
read more >
